Dither & Noise Shaping: Un abordaje práctico
Introducción
Al reducir la profundidad de bits de una señal digital (por ejemplo de 24 a 16), se producirá lo que se denomina “ruido de cuantización” .
Esto es producto de realizar un “truncado” (sacar los 8 bits menos significativos) de la señal de 24 y así llegar a la de 16 bits. A fin de reducir los efectos adversos de este proceso, es que aplicamos una técnica llamada “Dithering”.
Este artículo no intenta presentar la teoría detallada del proceso (que por cierto hay muchísima bibliografía al respecto), sino darle un abordaje más práctico, el cual es un poco más difícil de encontrar.[1]
Dither: Teoría Básica
Ya dijimos que el “ruido de cuantización” es un efecto que aparece luego de haber reducido la cantidad de bits a través del truncado la señal. La forma de minimizar este ruido de cuantización es a través del proceso de Dithering el cuál es simplemente el agregado de ruido blanco (aleatorio y uniformemente distribuido) a la señal original, antes de la reducción.
¿Agrego ruido blanco para eliminar “ruido de cuantización”? Esto no parece tener mucho sentido. Y es verdad, en una primera lectura, esto no parece ser un proceso muy útil.
La realidad es que el llamado “ruido de cuantización” no es un ruido como tal, sino más bien una distorsión. Por definición, para que una señal sea considerada como ruido, debe ser aleatoria y, por lo tanto, no debe estar relacionada (correlacionada) con otras variables. Y resulta ser que el ruido de cuantización, si lo está, y su relación es con el nivel de la señal a cuantizar.
Por lo tanto, lo que buscamos con proceso de Dithering es cambiar distorsión por ruido.[2]
¿Y por qué eso sería un buen cambio? Bueno, resulta que la psicoacústica humana tolera mejor el ruido que la distorsión. Esta última resulta mucho más molesta y distractiva que el ruido en sí mismo.
Dither: La práctica
A continuación se presentan los resultados de mediciones realizadas con una señal de 24-bits 997Hz a 2LSB (least significant bits) a la que se ha procesado con distintos plugins o DAWs, para convertirla a 16-bits. Como se mencionó anteriormente, con el proceso intentamos bajar la distorsión a costa de un mayor ruido, y por lo tanto podemos medir parámetros relacionados con estos fenómenos, a saber: TD (Total Distortion) y SNR (Signal to Noise Ratio).
A los fines de considerar qué es distorsión y qué es ruido, he seleccionada el siguiente criterio: si las señales presentes están a un nivel mayor de -30dBc,son consideradas como distorsión. Para las restantes, su clasificación será como ruido.
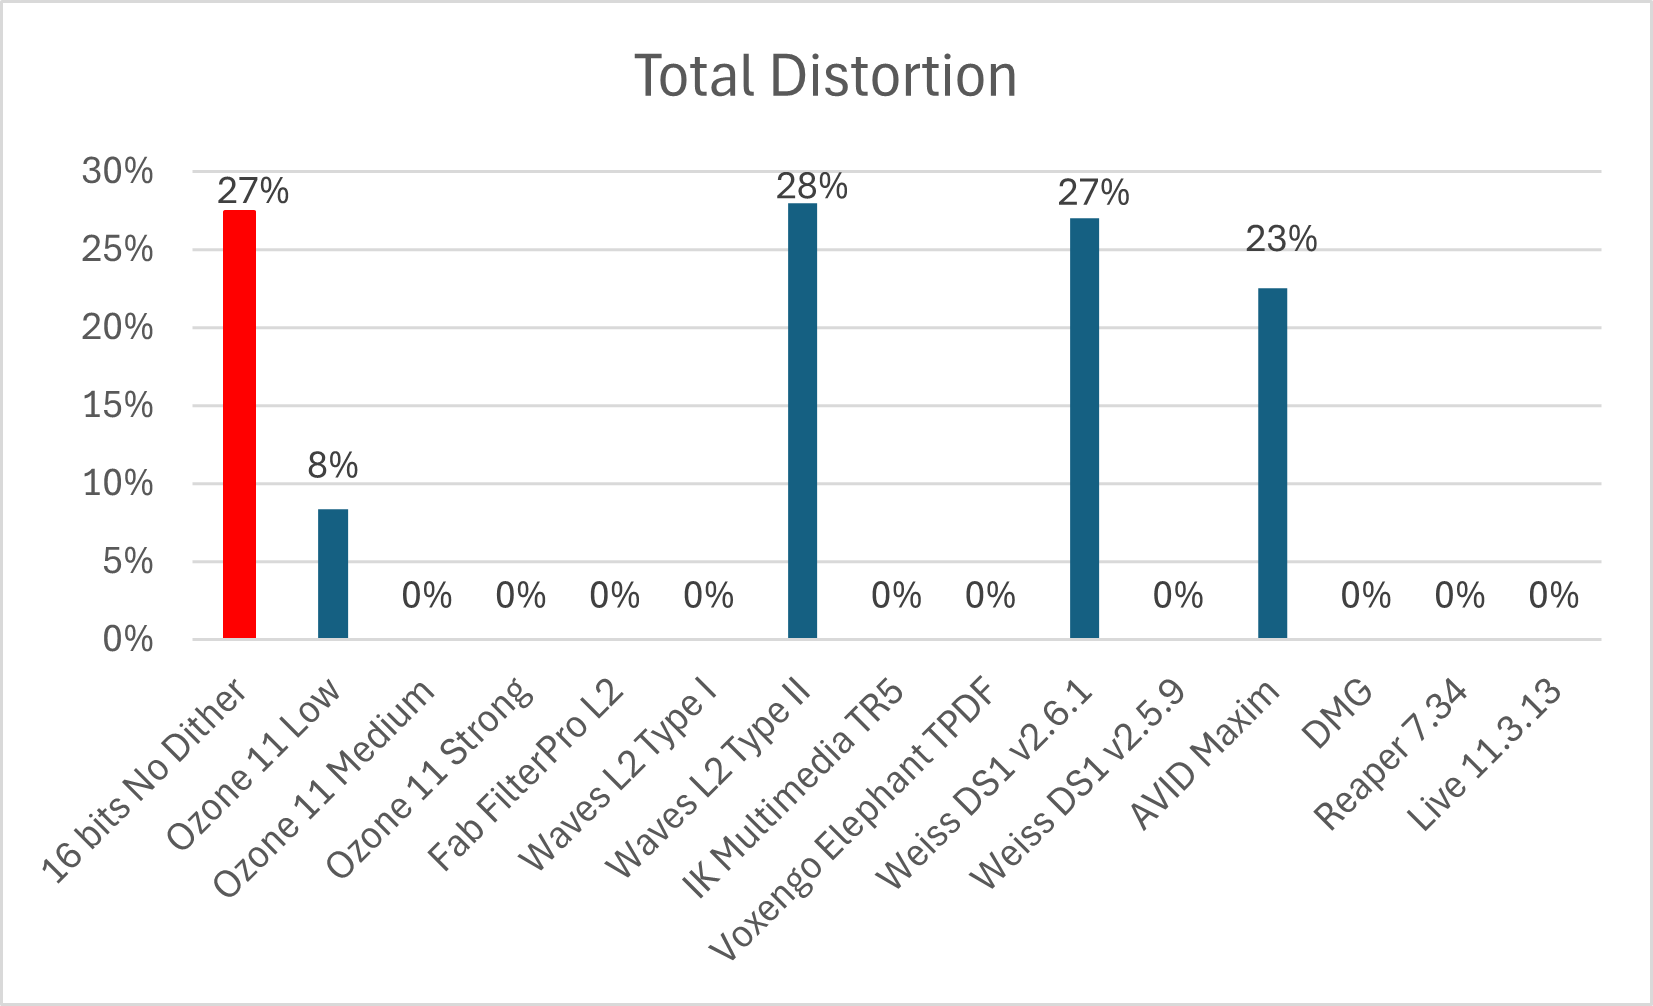
Figura 1: Distorsión total (TD) en la señal convertida a 16 bits.
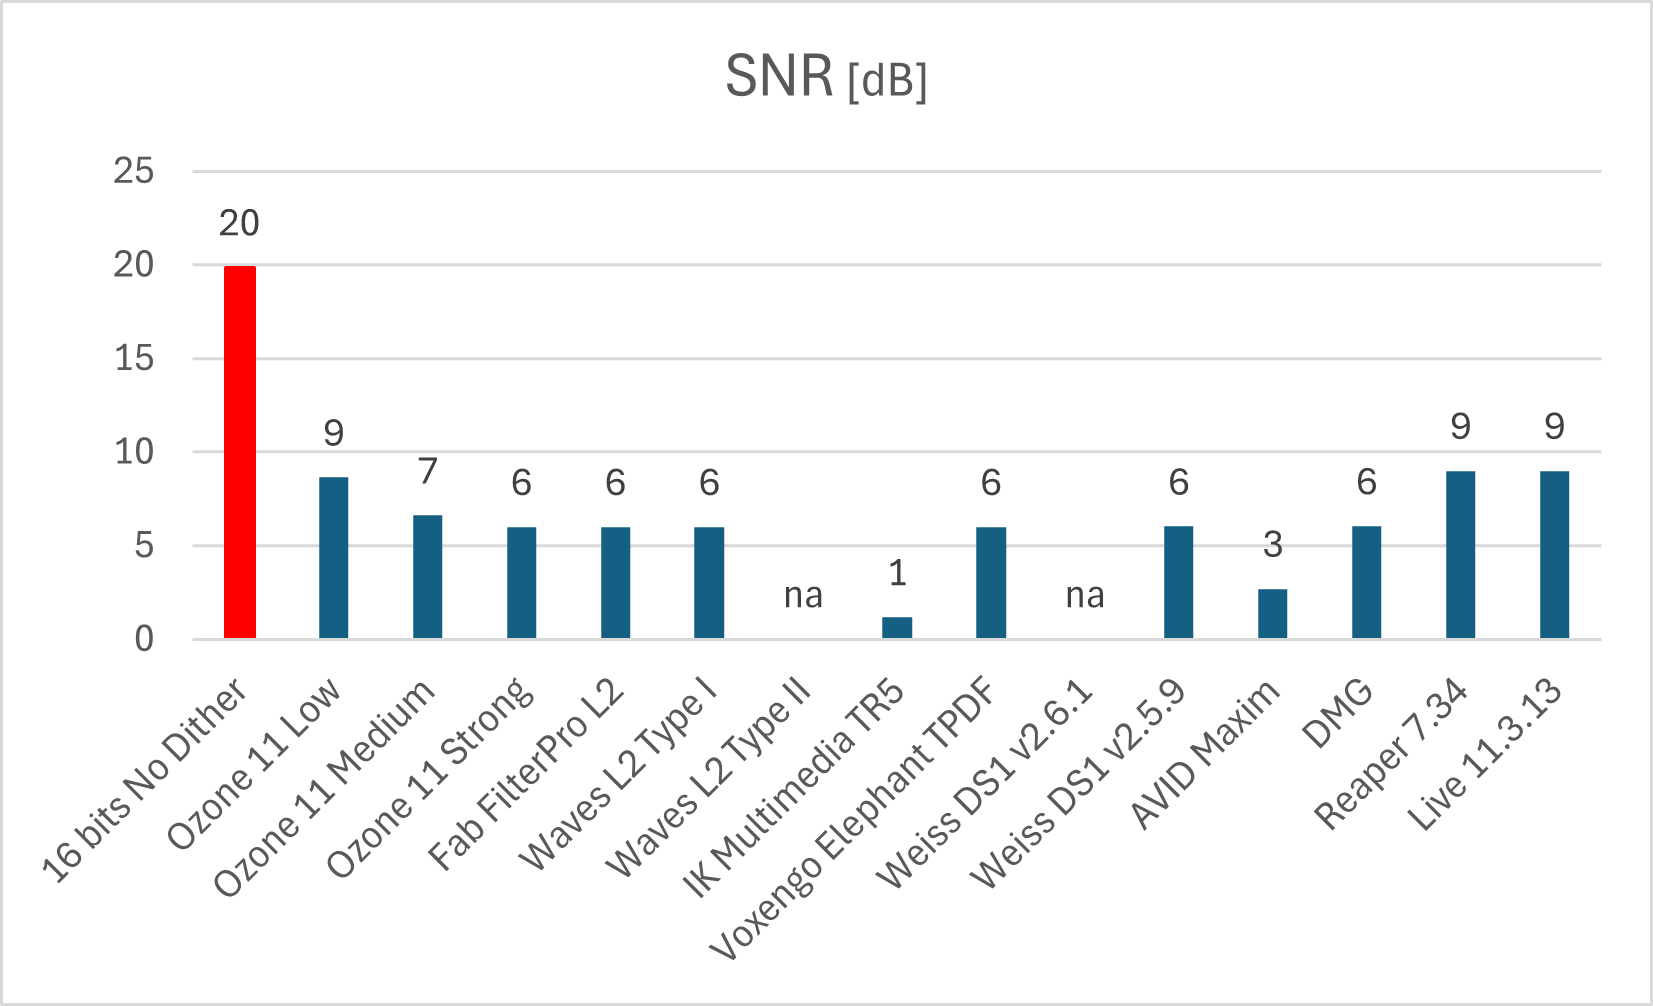
Figura 2: Relación Señal a ruido (SNR). Si el proceso no baja significativamente la distorsión, no se procede a medir este parámetro (na).
En la Figura 1 podemos ver el impacto en la distorsión en las señales cuantizadas a 16-bits con el agregado de dither.
Vemos como la distorsión se reduce drásticamente (o se anula a los fines prácticos) con respecto a la señal original sin dither. ¡Exactamente lo que queríamos lograr!
En la Figura 2 vemos el precio a pagar por esa reducción. Se observa fácilmente la degradación de la relación SNR, debido al haber introducido el dither (aka ruido).
Vemos también que hay algunos procesadores que arrojan unos resultados particulares (Waves L2, Weiss DS1 v2.6.1, Maxim).
En relación a estos, me gustaría solo comentar el caso del plugin de Softube Weiss DS1, en el cuál la versión actual (v2.6.1) incorpora autoblanking mientras que la anterior (v2.5.9) no lo tenía. Esto hace que para los niveles muy bajos de señal (como los utilizados en estas mediciones), la nueva versión no aplique dithering y, por lo ende, vemos los mismos valores de distorsión y SNR que en la señal de 16-bits sin dither.[3] Por tal motivo, el comportamiento de ambas versiones es diferente para estos niveles.
La selección de la intensidad del dither (en aquellos plugin que lo permiten), afectan al porcentaje de muestras que cambian de estado, o dicho de otra manera, que modifican su nivel con respecto a la señal original. Valores típicos para dither de baja intensidad rondan el 20%, para medios un 30% y altos de 35% en adelante.[4]
Algo interesante para mencionar es que la aplicación del dither es independiente en cada canal. Por ejemplo, para el caso del procesamiento con dithering en stereo, el generado para el canal izquierdo será independiente al generado para el derecho.
El Noise Shaping
El modelado del ruido (Noise Shaping) es una técnica que me va a permitir, redistribuir el ruido a zonas de frecuencia de menor percepción acústica. Si el dither agrega ruido uniformemente distribuido, el noise shaping lo “acomoda”.
En otras palabras, se trata de reducir la potencia de ruido en zonas de mayor sensibilidad psicoacústica (medias y medias altas) y aumentarla en las zonas de menor sensibilidad (altas frecuencias). Con esto logro mejorar la percepción de la relación señal a ruido.
En la teoría, la potencia total de ruido se mantiene inalterada (solo existe redistribución) pero en la implementación práctica la misma aumenta luego de aplicar noise shaping. Sin embargo, esto es transparente para la escucha, ya que el oyente efectivamente percibirá una reducción del ruido frente a la señal útil, logrando una mejora notable en la calidad total percibida.
Los distintos niveles de noise shaping (en el caso que sea seleccionable), tiene que ver con la cantidad de potencia desplazada hacia las frecuencias psicoacústicamente menos sensibles.
A diferencia del Dither, que no tiene mucha personalización posible[5], el Noise shaping sí puede tener (y de hecho lo tiene) un trabajo de ajuste importante. Muchos de los fabricantes utilizan distribución de ruido basada en modelos desarrollados por ellos de manera de optimizar los efectos psicoacústicos. Es así que vemos siglas como: POWr, MBIT, IDR, UV22, etc.
De forma sencilla se puede insertar un analizador de espectro, y analizar las curvas de ruido de las distintas marcas y modelos de plugins.
Resultados de Mediciones
Se procedió a medir 2 indicadores, a saber:
•Noise Power (NPow) [dBFS]: indica la potencia total de ruido.
•Noise to Mask Ratio (NMR) [dB]: indica el enmascaramiento del ruido.
Ambos indicadores se evaluán en el espectro completo (10Hz – 22050Hz)
En la Figura 3, vemos reflejado los valores obtenidos de Noise Power (Npow) y Noise to Mask Ratio (NMR)[6] para distintos niveles de dithering de los plugins medidos.
La convención de etiquetado es:
Nombre plugin / Tipo de Dither / Intensidad Noise Shaping.
Por ejemplo: Ozone / Medium / Low: indica que corresponde al plugin Ozone con un Dither Medium y una intensidad de Noise Shaping Low.
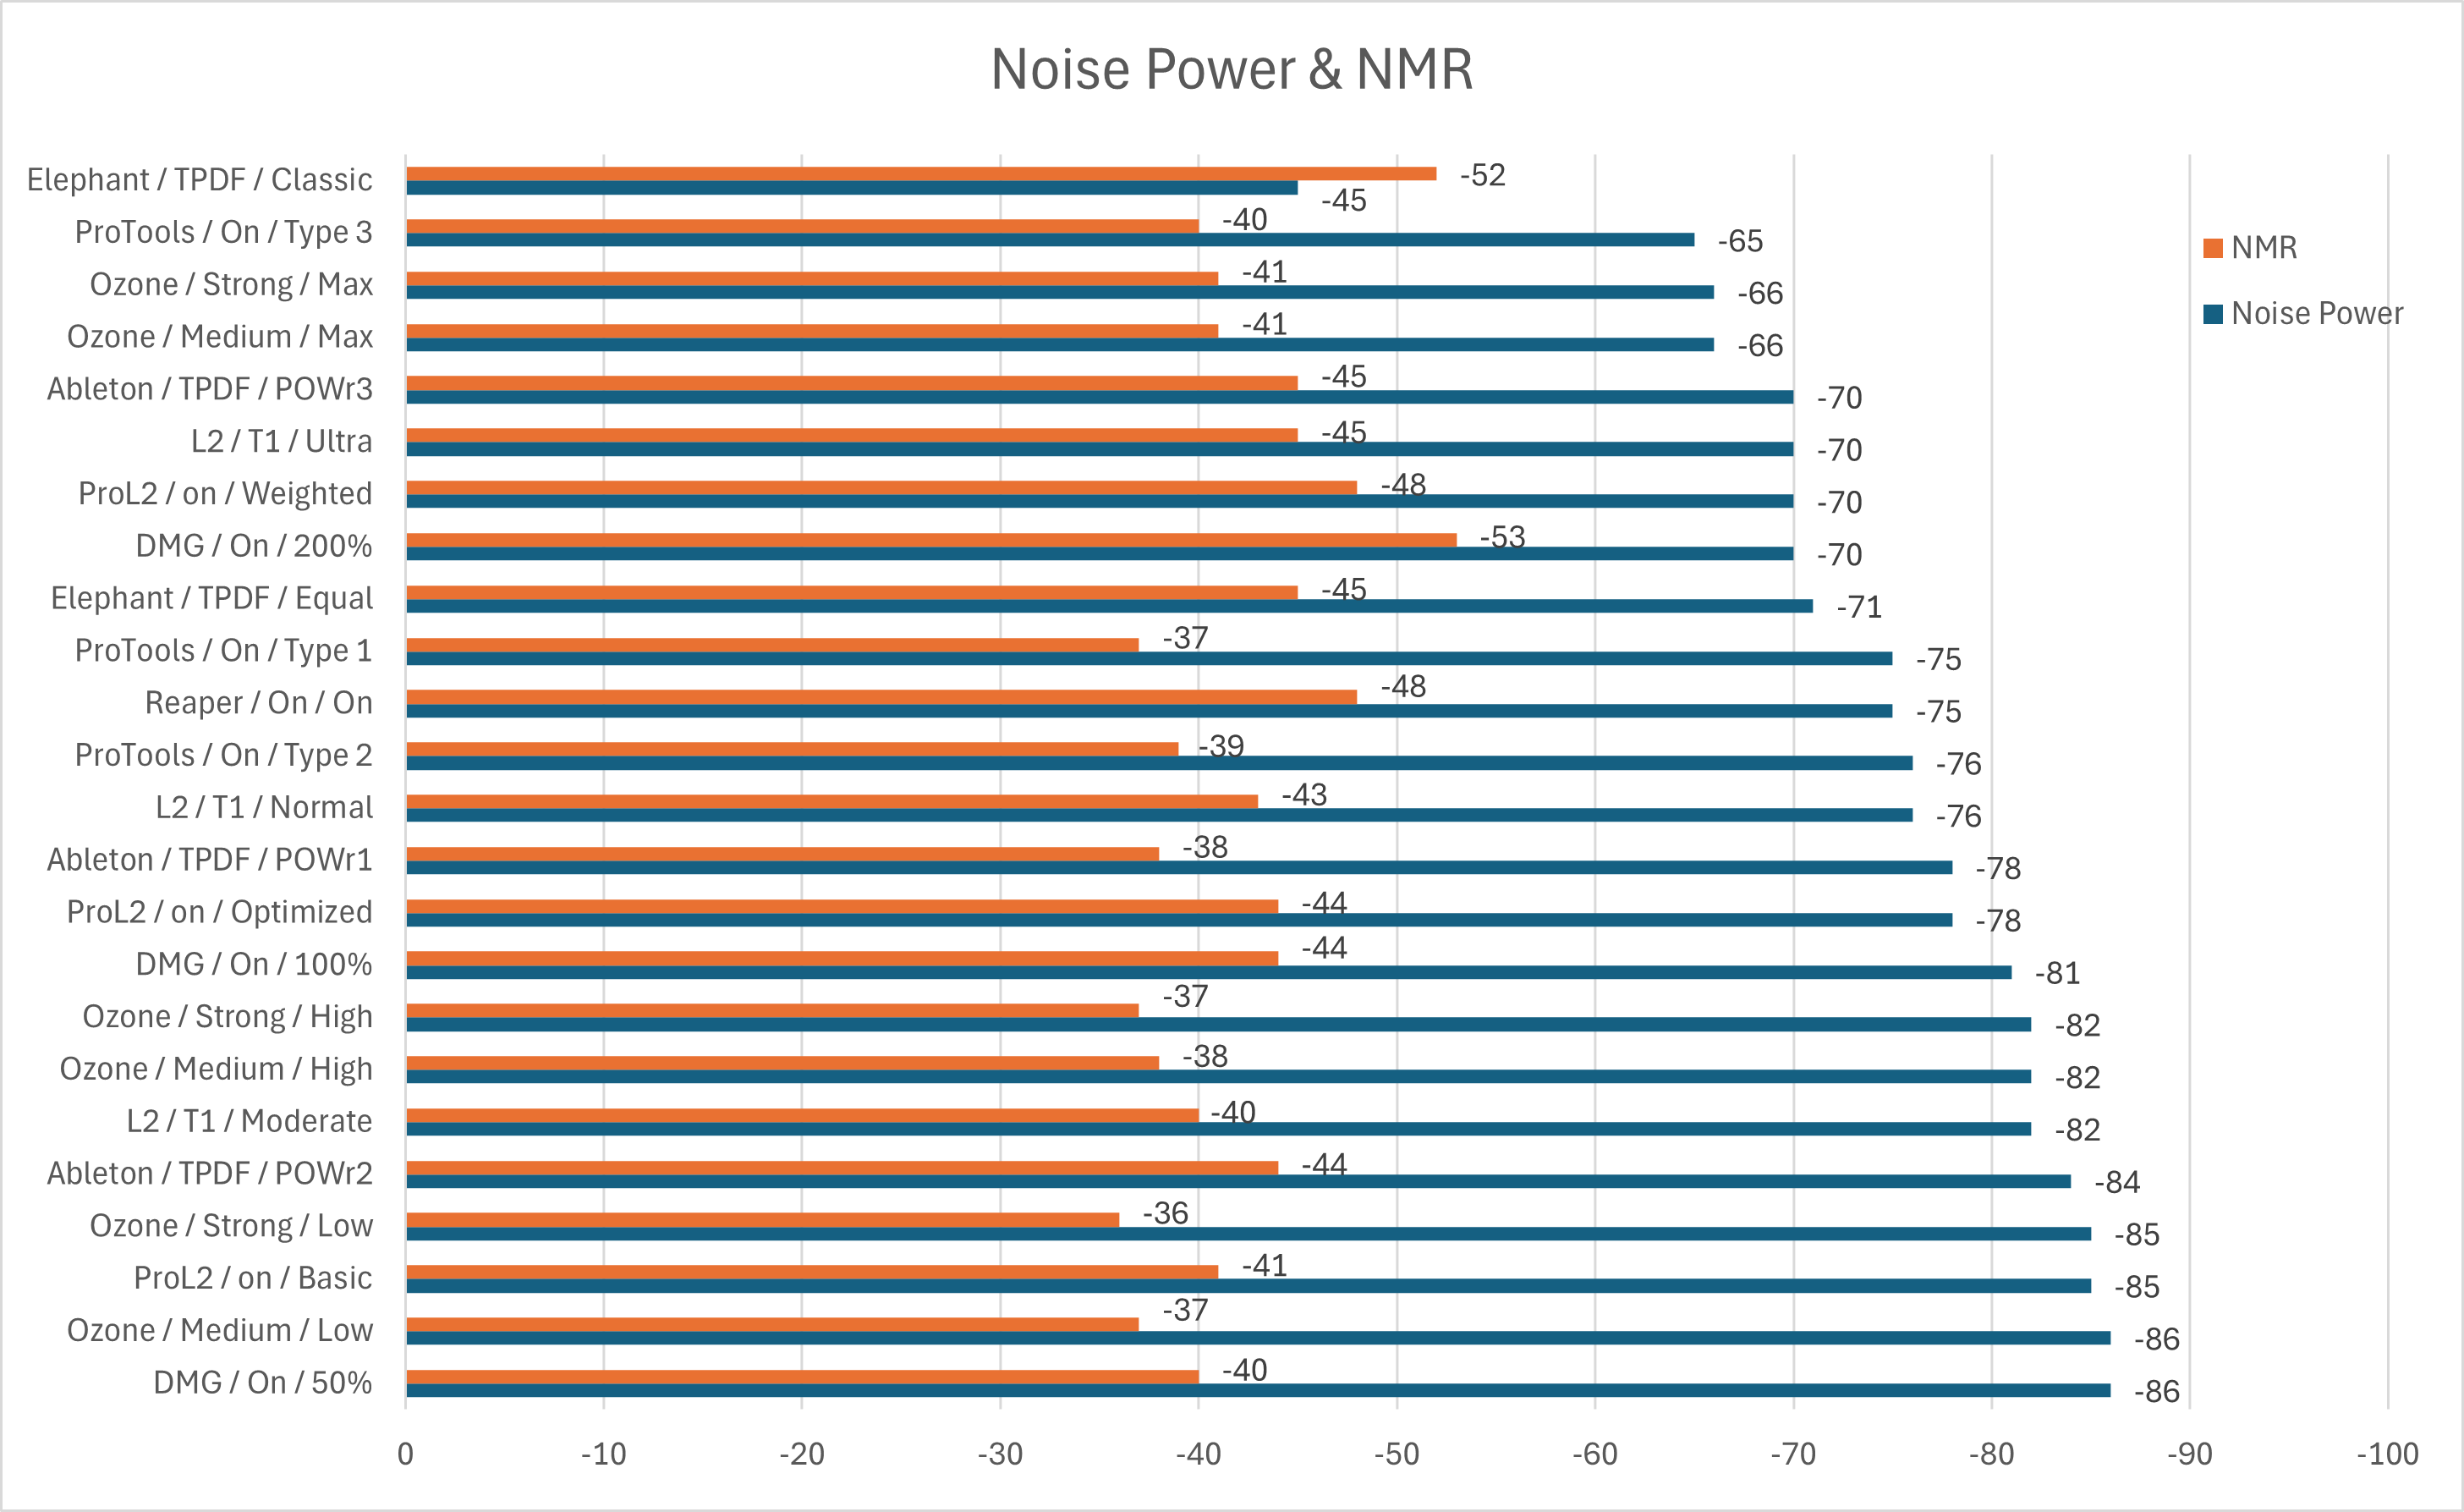
Figura 3: Niveles de Noise Power y Noise to Mask Ratio para cada combinación medida. Si el procesador presenta autoblanking, no se muestra en el gráfico.
Recordar que el Noise Power se relaciona con la potencia de ruido que se encuentra en la banda y el NMR a cuánto psicoacústicamente se percibe dicho ruido. Mayores niveles de Noise Power (menos negativos) significan mayor ruido presente mientras que menores valores de NMR (más negativos) resultan en una menor percepción del mismo.
Se puede apreciar cómo, a medida que aumento la intensidad del noise shaping, el parámetro NPower (potencia de ruido sobre toda la banda) aumenta y en NMR (que es un parámetro de enmascaramiento de ruido) en general disminuye.
La escucha: Comparaciones
Si bien los resultados son indicadores que nos orientan hacia las características de la señal procesada, no nos dan una idea cabal de cómo se escucha cada combinación.
¿Es una distorsión de x% algo tolerable a estos niveles? ¿Qué tan bueno o malo es un valor de SNR de ydB? O ¿cuánto es la diferencia de percepción entre los distintos valores de NMR?
Para que el lector pueda tener una representación auditiva, he creado una página en donde se pueden escuchar cada una de las señales procesadas, con el fin de poder ayudarlo a seleccionar el Dither y/o Noise Shaping que más le resulte conveniente.
Se puede validar cómo mediciones con una potencia de ruido (NPower) menor efectivamente se traduce en una menor percepción auditiva, o incluso combinaciones con el mismo valor de NPower pero menor NMR, se perciben con menor carga ruidosa, validando los resultados de las mediciones.
La realidad es que como todo esto ocurre a niveles muy bajos de señal, en la mayoría de los casos no será un tema de extrema preocupación. Pero como siempre estamos en la búsqueda de la excelencia… ¿por qué privarse de elegir lo que más nos sirva?
El siguiente link apunta a una página donde he creado una herramienta para poder comparar varias combinaciones de Dither y Noise Shaping, tanto para una señal senoidal como para una de instrumento.
Si bien se puede acceder desde cualquier dispositivo, se recomienda ingresar desde una PC ya que se accederá a la versión completa. El acceso desde un dispositivo móvil, redireccionará a la versión reducida de la herramienta.
Dither & NS Benchmark Tool
Ing. Pablo Panitta
Soundins
email: soundinsda@gmail.com
March 2025
Notas
[1] Importante: El presente trabajo no constituye ninguna representación, recomendación o preferencia hacia ninguna marca o modelo mencionado. No se realiza un ranking de mejor o peor funcionamiento, sino solamente se exponen los resultados.
[2] El agregado de ruido a la señal a recuantizar hace decorrelacionar el error de cuantización del nivel de señal, y por lo tanto lo transformamos en verdaderamente ruido en vez de distorsión.
[3] Ingenieros de Softube me han confirmado que se ha introducido este cambio con el fin de reducir el consumo de CPU para señales de entrada de tan bajo nivel.
[4] La intensidad del Dither también puede relacionarse con los LSB (nivel) agregados (típicamente 1, 2 o 3 LSB). Generalmente para distribuciones triangulares, lo común son 2 LSB.
[5] Parámetros que pueden variar en el Dither son su intensidad y su distribución (Rectangular, Triangular, Gaussiana). En audio, el uso común y recomendado es la distribución triangular (aunque unos pocos plugin permiten seleccionar el tipo a aplicar).
[6] Noise to Mask Ratio (NMR) es una medida de enmascaramiento del ruido. Valores más negativos indican que el perfil de ruido se encuentra más alejado del umbral de enmascaramiento, presentando una menor percepción psicoacústica.
Dither & Noise Shaping: A Pragmatic Approach
Abstract
When reducing the bit depth of a digital signal (e.g., from 24 to 16), what is known as “quantization noise" will occur. This is a result of performing a "truncation" (removing the 8 least significant bits) of the 24-bit signal to convert it to 16-bit word length signal. In order to reduce the adverse effects of this process, a technique called “Dithering” is applied.
This article does not attempt to address the theory of the process (of which there is plenty of literature on the subject), but rather to give it a more practical approach, which is a little more difficult to find.[1]
Dither: The Basic Theory
As we mentioned, "quantization noise" is an artifact that appears after reducing the number of bits by truncating the signal. The way to minimize this quantization noise is through the process of Dithering, which is simply the addition of white noise (random and uniformly distributed) to the original signal before the reduction.
Adding white noise to eliminate 'quantization noise'? This does not seem to make much sense. And it is true, at first glance, this does not seem to be a very useful process.
The reality is that the so-called "quantization noise" is not noise as such, but rather a distortion. By definition, for a signal to be considered noise, it must be random and, therefore, not related (correlated) to other variables. And it turns out that quantization noise is related, and its relationship is with the level of the signal to be quantized.
Therefore, what we aim to achieve with the Dithering process is replace distortion for noise.[2]
And why would that be a good change? Well, it turns out that human psychoacoustics tolerate noise better than distortion. The latter is much more annoying and distracting than the noise itself.
Dithering in Practice
The following are the results of measurements made with a 24-bit 997Hz signal at 2LSB (least significant bits) that has been processed with different plugins or DAWs to convert it to 16-bits. As mentioned above, with the process we try to lower the distortion at the cost of increased noise, and therefore we can measure parameters related to these phenomena, namely: TD (Total Distortion) and SNR (Signal to Noise Ratio).
For the purpose of considering what constitutes distortion and what constitutes noise, I have selected the following criterion: if the present signals are at alevel greater than -30dBc, they are considered as distortion. For the remaining signals, their classification will be as noise
Figure 1: Total Distortion (TD) above-30dBc.
Figure 2: Noise to Signal Ratio (SNR). If the process doesn’t significantly reduce the distortion, SNR is not measured and indicated as “na”.
In Figure 1 we can see the impact on the distortion in the 16-bit quantized signals with the addition of dither. We see how the distortion is drastically reduced (or canceled for practical porpuse) with respect to the original signal without dither. This is exactly what we wanted to achieve!
In Figure 2 we see the price to pay for that reduction. The degradation of the SNR ratio, easily observed, due to the introduction of dither (aka noise).
We also see that there are some processors that give peculiar results (Waves L2, Weiss DS1 v2.6.1, Maxim).
In relation to these, I would like to comment only the case of the Softube Weiss DS1 plugin, in which the current version (v2.6.1) incorporates autoblanking while the previous one (v2.5.9) did not. This means that for very low signal levels (such as those used in these measurements), the new version does not apply dithering and, therefore, we see the same distortion and SNR values as in the 16-bit signal without dither. For this reason, the behavior of each versions is different at these levels.[3]
The selection of the dither intensity (in those plugins that allow it), affects the percentage of samples that change state, or in other words, that modify their level with respect to the original signal. Typical values for low intensity dither are around 20%, for medium 30% and high 35% and above.[4]
Something interesting to mention is that the application of dither is independent in each channel. For example, in the case of stereo dithering processing, the one generated for the left channel will be independent of the one generated for the right.
The Noise Shaping
Noise shaping is a technique that will allow me to redistribute noise to frequency zones of lower acoustic perception. If dither adds uniformly distributed noise, noise shaping "molds" it.
In other words, it is about reducing the noise power in areas of greater psychoacoustic sensitivity (mid and mid-high) and increasing it in areas of lower sensitivity (high frequencies). This makes it possible the improvement in the perception of the signal-to-noise ratio.
In theory, the total noise power remains unchanged (there is only redistribution) but in practical implementation it increases after applying noise shaping. However, this is transparent to listening, since the listener will effectively perceive a reduction of noise in front of the useful signal, achieving a noticeable improvement in the overall perceived quality.
The different levels of noise shaping (if selectable), have to do with the amount of power displaced towards the psychoacoustically less sensitive frequencies.
Unlike Dither, which does not have much possible customization[5], Noise shaping can (and in fact does) have significant adjustment work. Many manufacturers use noise distribution based on models developed by them in order to optimize psychoacoustic effects. This is how we see acronyms such as: POWr, MBIT, IDR, UV22, etc.
Very easily, you can insert a spectrum analyzer to analyze the noise curves of different plugin brands and models..
Measurements Results
Two indicators were measured, namely:
• Noise Power (NPow) [dBFS]: indicates the total noise power.
• Noise to Mask Ratio (NMR) [dB]: indicates the masking of the noise.
Both indicators are evaluated across the full spectrum (10Hz – 22050Hz).
In Figure 3, we see reflected the values obtained for Noise Power (Npow) and Noise to Mask Ratio (NMR)[6] for different levels of dithering of the measured plugins. The labeling convention is:
Plugin Name / Dither Type / Noise Shaping Intensity.
For example: Ozone / Medium / Low: indicates that it corresponds to the Ozone plugin with a Medium Dither and a Low Noise Shaping intensity.
Figure 3: Noise Power level and Noise Masking Ratio for each process tested.
Remember that Noise Power is related to the noise power found in the band and NMR to how much that noise is psychoacoustically perceived. Greater values in NPower (less negative) means more noise power added while lesser ones (more negative) in NMR means less perceived noise.
It can be seen how, as increasing the intensity of the noise shaping, the NPower parameter (noise power over the entire band) increases and the NMR generally decreases.
Let’s Listen: The Tool
Although the results are based on real measurements, they do not give us a complete idea of how each combination sounds. Is a distortion of x% something tolerable at these levels? How good or bad is an SNR value of ydB? Or... how much is the perception difference between the different NMR values?
In order to provide the reader with an auditory representation, I have created a page Search for results of the tests, which can help them choose the Dither and/or Noise Shaping that best suit their needs.
It can be validated how measurements with a lower noise power (NPower) effectively translate into a lower auditory perception, or even combinations with the same NPower value but lower NMR, are perceived with less noise load, validating the measurement results.
The reality is that as all this occurs at very low signal levels, in most of the cases it will not be a matter of extreme concern. But as we are always in search of excellence... why deprive ourselves of choosing what best suits us?
The following link points to a page where I have created a tool to compare various combinations of Dither and Noise Shaping, both for a sinusoidal signal and for an instrument signal.
Although it can be accessed from any device, it is recommended to enter from a PC since you will access the full version. Access from a mobile device will redirect you to the reduced version of the tool.
Dither & NS Benchmark Tool
Ing. Pablo Panitta
Soundins
email: soundinsda@gmail.com
March 2025
Notes
[1] Important disclosure: This work does not constitute any representation, recommendation, or preference towards any brand or model mentioned. No ranking of better or worse performance is made, but only the results are presented.
[2] The addition of noise to the signal being requantized decorrelates the quantization error from the signal level, and therefore, we transform it into true noise instead of distortion.
[3] Softube engineers have confirmed that this change was introduced in order to reduce CPU consumption for signals with such low input levels.
[4] Dither intensity can also be related to the added LSBs (level) (typically 1, 2, or 3 LSBs). Generally, for triangular distributions, 2 LSBs is the common choice.
[5] Dither parameters that can be varied include its intensity and distribution type (Rectangular, Triangular, Gaussian). In audio, the triangular distribution (TPDF) is the most common and recommended choice (though a few plugins allow you to select the type to apply).
[6] Noise to Mask Ratio (NMR) is a measure of noise masking. More negative values indicate that the noise profile lies further from the masking threshold, resulting in lower psychoacoustic perception.